Vibration analysis is a key technology in the ever-changing world of IIoT and predictive maintenance.
It may be the key technology for assessing the health of rotating assets in industry and giving your organization an early warning of deterioration and impending asset failure.
It drives high asset availability through the life cycle.
But what’s it all about?
Vibration basics
Keeping it simple, vibration is the oscillation or motion of an asset or component back and forth from its position of rest.
Think of a pendulum being released from its highest point.
It will swing back and forth until all the vibration energy has dissipated. And then it returns to its position of rest.
The only difference with your assets is that the vibration stops only when the asset’s rotational energy stops. The primary energy source – usually the motor- must stop for the vibration to stop.
But can such a simple phenomenon as vibration tell you what’s going wrong in your assets?
Yes!
Measured vibration parameters such as amplitude, RMS, and period allow you to calculate and see the mechanical, rotational, and frictional forces taking place in your assets.
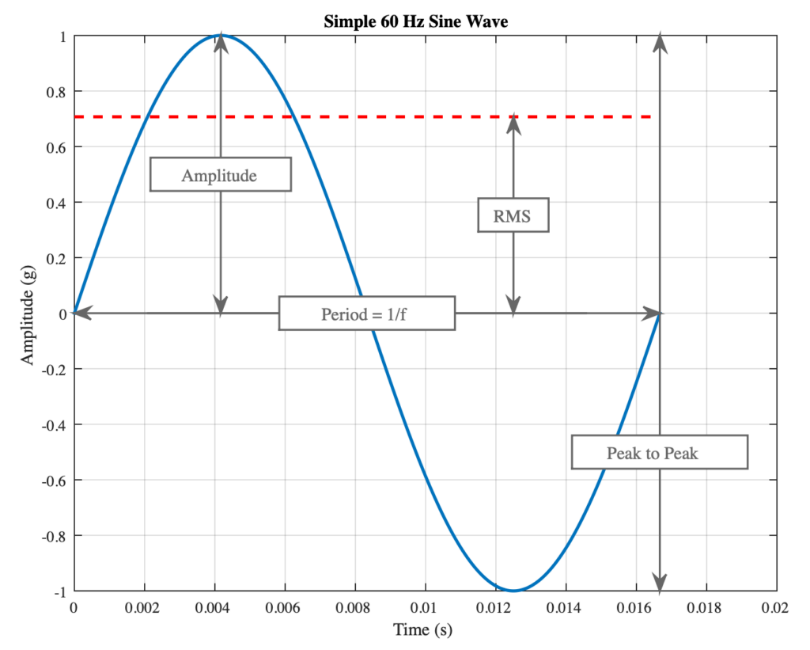
Source: https://www.motioncontroltips.com/how-is-machine-vibration-defined/
The forces within the asset or equipment cause vibration and this is typically measured at the bearing housing. The forces come from the rotating elements in the asset such as the rotors, gears, shafts, bearings, and impellers.
Not all forces and vibration are bad news.
But when they are, we use a Fast Fourier Transform (FFT) to be able to view them in the time and spectral domains.
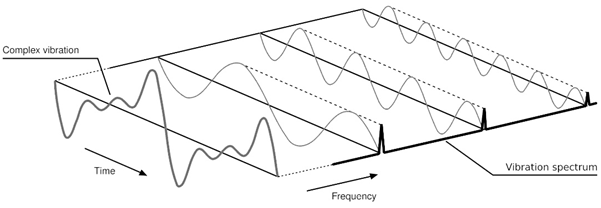
Source: https://www.motioncontroltips.com/how-are-fast-fourier-transforms-used-in-vibration-analysis/
It is here we can see their individual frequencies and amplitudes – in acceleration or velocity - and relate their patterns to specific asset faults.
What kinds of fault can it detect?
There are lots of potential faults that vibration analysis can detect, here are just a few:
- Worn bearings
- Pump cavitation
- Asset to asset misalignment
- Gear teeth wear
- Structural cracks in asset foundations
- Lack of lubrication
- Worn drive belts
- Resonance
Have any of these caused you significant downtime or headaches at your plant?
We bet they have!
The benefits of vibration analysis and condition-based maintenance in general are well known:
- Higher asset availability
- Increased production output
- Less unplanned downtime
- Reduced maintenance and life cycle costs
- Optimized human resources
- Reduced invasive PMs (overhauls and component replacements)
- Improved maintenance planning and scheduling
- Better spares forecasting
- Root cause analysis information for defect elimination
Vibration analysis is a mature predictive maintenance technology and is used in almost all industries one can think of. It is a go-to predictive technology in industry verticals such as oil and gas, food and beverage, paper and pulp, steelmaking, automotive, mining, aviation, nuclear, chemicals and many more.
What about the process of condition monitoring and vibration analysis?
Vibration Analysis
The condition monitoring process is straightforward and can be split into three parts: detection, diagnosis, and prognosis. Let’s have a look at them:
Detection - Whether you are collecting data manually every four weeks or by the hour with an ‘online’ system, the data can be trended. What you are really trending is the severity of the vibration at the bearing housing.
First, it is a best practice to set baseline levels for all of your assets. This is so we know their normal operational levels – assuming they are in good condition to start with.
Once the vibration breaches a pre-set alarm level (in mm/s or Gs for example), then it will be time to investigate further. There are international standards that can help you set up your alarm levels such as the ISO 10816 series.
Diagnosis – The question we are asking here is: what’s wrong with the machine?
Now, although you’re measuring vibration at the bearing, it does not mean that the defect forcing function is the result of a faulty bearing. It could be a multitude of causes. Look here at some typical reasons for bearing wear which you can detect with vibration analysis:
- Bearing wear due to misalignment
- Bearing wear due to soft foot
- Bearing wear due to unbalance
- Bearing wear due to looseness
And how do you find them?
Earlier we saw how complex vibration signals can be viewed in the time domain or the frequency domain. This is where the analysis is performed. Both domains contain valuable information for diagnosing common equipment faults. The time domain shows us the severity of vibration against time. This is useful for diagnosing bearing faults, cavitation, unbalance, beat vibration, and gear teeth damage. The frequency domain shows us the individual frequencies that make up the complex vibration. It is particularly good for diagnosing bearing faults also, plus looseness, unbalance, misalignment, belt problems, lack of lubrication, soft foot, and much more.
Prognosis – This question is the toughest of all. How long will it last before it fails?
Machines are often complex and exhibit complex mechanical behavior. No two are the same.
Estimating how long a motor or pump will last once a defect is detected is very challenging. But it can be based on the steepness of the vibration trend. How fast is the vibration severity climbing over time? Once you detect an incipient fault, then you may take more regular vibration measurements – especially on critical plant. You can also estimate the remaining useful life if you have data on previous failures or a good understanding of the specific P-F (Potential Failure – Failure) curve for the equipment. The prognosis phase is difficult, but if you have good data and equipment knowledge then you can reduce the risk of an unexpected failure.
The key here is to spend your time focusing on the common problems found on rotating equipment. The ones we’ve already mentioned such as misalignment, bearing wear, looseness, and unbalance are the most common. Don’t spend too much time on exotic and rare occurrence issues.
Imagine you’re driving along in your car. Gradually, over several weeks, it starts shaking more and more as you accelerate through the gears. The vibration severity has increased. You take it to the garage, and they are going to look for the common problems. Things like wheel unbalance or low tire pressure. They wouldn’t strip the gearbox down and look for missing gear teeth or eccentric gears.
This is what condition monitoring is all about: focusing on the common problems.
And diagnosing them accurately and quickly.
Wireless Vibration Sensors
Vibration sensors have changed a lot.
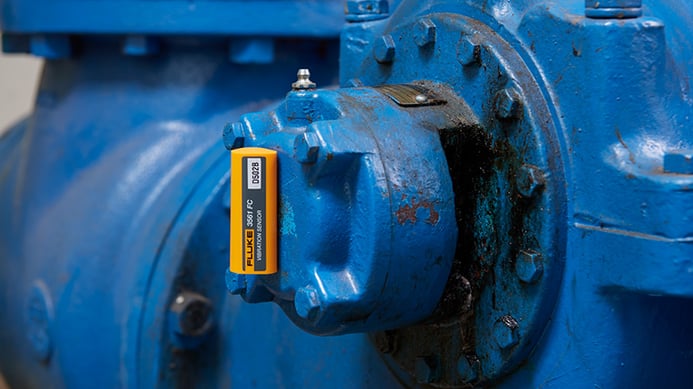
Gone (or going) are the heavy, cabled, externally powered, single axis accelerometers of the past. Nowadays you are more likely to see wireless, Bluetooth, battery-powered, 3 axis vibration sensors. You will now find they have the ability to be data loggers, to ‘wake up’ and record when certain vibration thresholds are breached, they will have ISO alarm levels built in, and many can also record asset temperature.
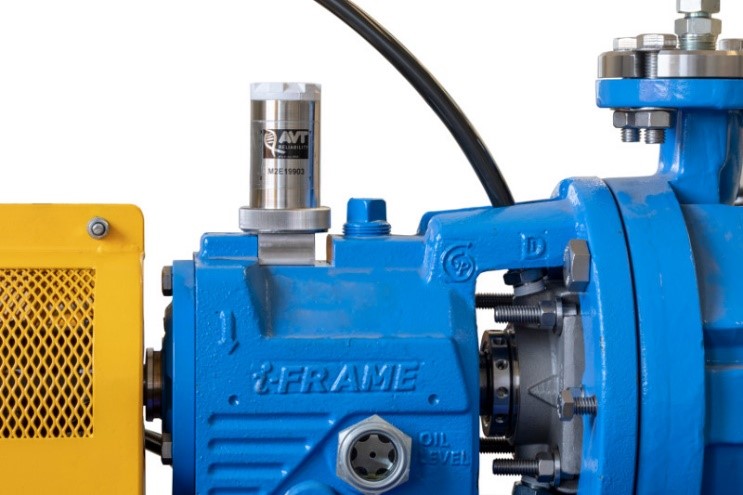
Source: https://www.machinesentry.com/products/hardware/msf-1
The traditional, larger condition monitoring providers are changing their product lines and business models as we move into the age of industry 4.0, and there are many new, younger entrants to the market challenging the status quo and disrupting old business models.
Vibration Analysis: The Before & After
So, we know that condition monitoring – and more specifically vibration analysis - has changed, right?
But let’s look at how it’s changed in practical terms.
Before - manual labor was the order of the day. First up, permits may be required to access some assets due to safety risks. In most global plants, that’s 15 to 30 minutes of your time gone. Back at the office, a technician would need to download a ‘route’ to their data collector. They would then go out and walk around plants with a cabled accelerometer and a data collector (usually a heavy one!). The technician would visit high criticality machines only, and measure every single axis (X, Y, Z) at each bearing individually. They may spend 5 to 15 minutes at each machine. With tired feet, they’d then go back to the office and upload the data to a proprietary software on a standalone computer. This meant the data only resided on that computer and only people with access could look at it.
Nothing on the cloud.
Hopefully, they wouldn’t forget to sign off the safety permit as well.
The vibration analyst would then trawl through tons of data, analyze the data manually and update their Excel spreadsheet or Word document. Once this was done, they would then email out their recommendations and reports to maintenance planners and supervisors.
And hope for the best!
After 4 weeks, they would then repeat this cycle again.
(4 weeks has always been the default cycle for most vibration analysts to collect data. Not much thought has ever gone into why.)
But things are now changing…
After – The whole process is now a lot more automated.
No safety permits, and little or no walking around!
Three-axis, wireless vibration sensors are permanently installed on the asset (with a magnet, glue or studs) and the battery may need replacing every three years or so. Data is sent to a locally-mounted gateway device which is connected to the plant Wi-Fi signal. The gateway device then sends the data to cloud-based software which anyone with a login can access from anywhere in the world. Instead of data collected every 4 weeks, it is configurable – often to as low as every 60 seconds if necessary.
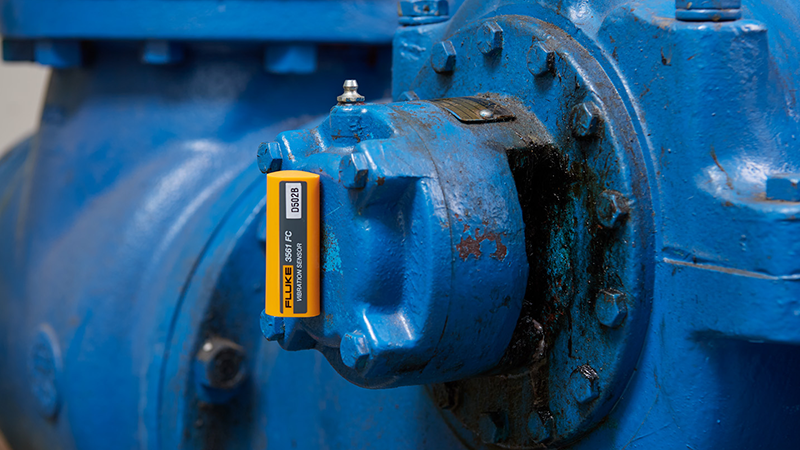
There is still the option to manually upload the data from the wireless sensors with a Bluetooth-connected device like a tablet or cell phone. Here the benefit is that a technician can walk around and perform a visual inspection of the asset at the same time if required, as well taking photos and making inspection notes.
The sensor can even be ‘mobile’ and moved to other assets temporarily for troubleshooting.
Alarm levels can be set to ISO standards or configured to individual assets. When alarms are breached, automated emails are sent to key stakeholders to warn of impending issues or the need for vibration analysis or root causes analysis.
Given the economies of scale, many more assets can be monitored than in the traditional model, not just critical assets.
Manual analysis of the data is still common, but as we move deeper into the digital transformation of industry 4.0 and the IIoT we move more towards predictive maintenance, machine learning, and algorithms playing a key role in the analysis.
Let’s now look at a simple categorization of two types of sensors: scanning sensors and screening sensors.
Scanning sensors
These are the more expensive vibration sensors which are suited to a company’s critical assets. These sensors typically contain self-diagnostics and vibration measurement validation. They have a degree of intelligence and perform a high volume of data processing. This is because after data validation, they send the time and frequency domain information to the gateway and cloud-based software for further analysis. You wouldn’t typically go to the cost of installing these on lower-critical and utility assets. They will also often have temperature sensors built in so the long term temperature can be trended alongside vibration.
Screening sensors
These sensors are much lower cost and are applied to lower criticality and utility assets. But they are well-suited to the IIoT approach. They often record overall vibration values and peak vibration only – that is to say, not the time and frequency domain information. This transfer a low volume of data. But the key is that given the low cost they can be used on many more assets than scanning sensors. They will capture data on the assets that are often neglected and ignored – but whose failure can still cause production losses, wasted costs, and organizational headaches.
What is the workflow?
Whilst we are moving rapidly into the digital transformation and IIoT, the vibration monitoring workflow is essentially the same. What has changed is that less time is wasted on unnecessary analysis, and costs have reduced significantly. Here is the typical workflow we see today:
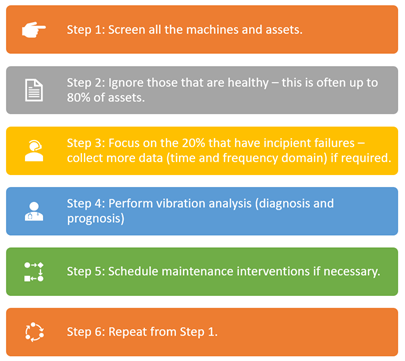
This simple workflow will allow you to focus your resources where they are needed.
Get a bigger bang for your bucks!
The great cost savings are made from automated data collection and the filtering out of healthy assets. This is where modern, asset-intensive, and operationally-efficient companies are making significant gains on their journey towards excellence, connectivity, and the industrial internet of things.
Be competitive.
And be part of that modern, data-driven journey towards lower costs, lower risks, and increased asset and business performance.
.png?width=388&height=200&name=Copy%20of%20Blog%20Featured%20Image%20(4).png)
.png?width=388&height=200&name=Copy%20of%20Blog%20Feature%20Image%20(6).png)
